▸ MSCI World ETFs and their distance from the Net index — the tracking difference we measure: click to open the table
When two sources show different returns “for the same index”, they are almost always looking at two of its three official versions — or at the same version in two currencies. It is the series’ final question, and the most practical one: after seeing who gets in and out, who sets the rules and how the move is executed, what remains is which number to use for judging the result. The answers sit in MSCI’s calculation handbook — 141 pages, June 2026 edition — which we read in full.
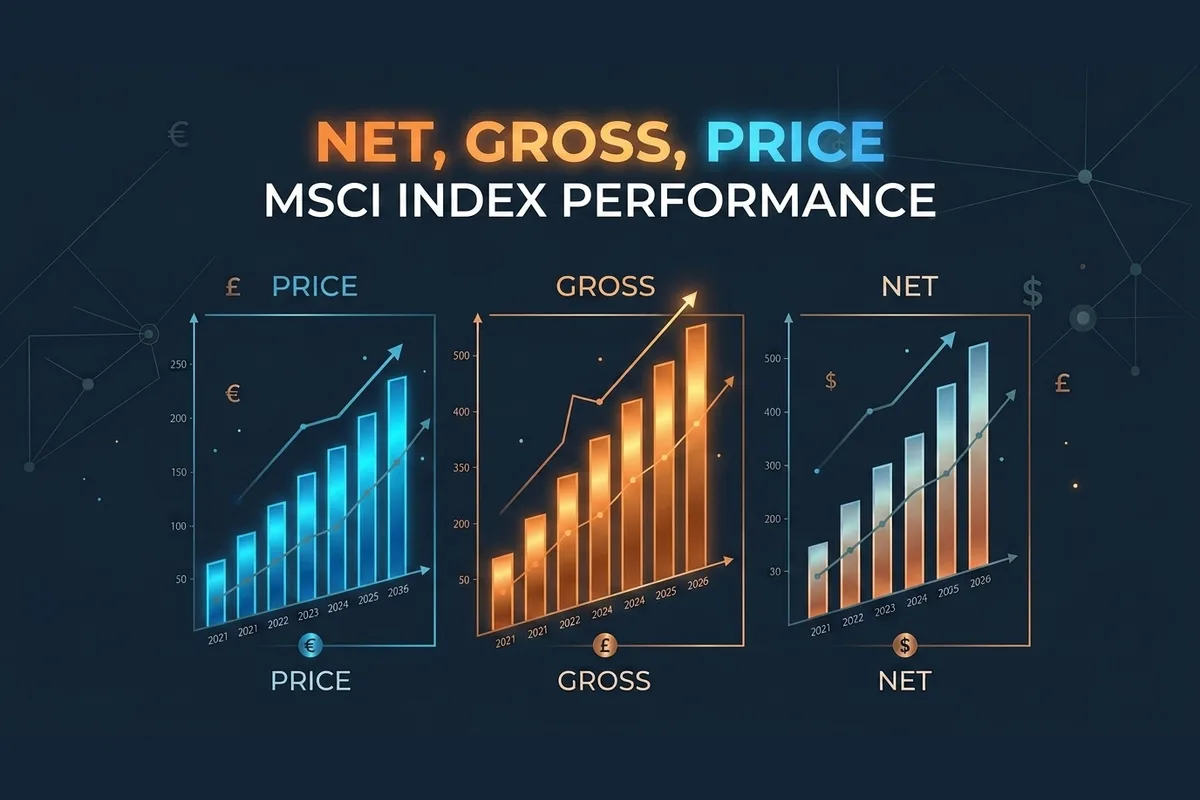
The short answer, before the details: the Price version counts prices only; the Gross version reinvests dividends in full; the Net version reinvests them after the highest possible withholding tax. ETFs are normally compared against Net — and precisely because Net assumes the worst tax case, a real fund can beat it: over the last year, 5 of the 7 MSCI World ETFs whose tracking difference we measure did.
Three numbers, one index
In 2025 the MSCI World returned +21.09%. Or +7.21%. Or +6.77%. None of the three is wrong: the first is the Net version in dollars, the second the Gross in euros, the third the Net in euros — all from official MSCI factsheets, reading of 31 July 2026. Two axes separate these numbers: what is done with dividends (nothing, everything, or the after-tax amount) and which currency you measure in. This instalment walks the first axis, then the second.
Price: prices only (with a 5% exception)
The Price version tracks market prices, weighted by capitalisation: when a company pays an ordinary dividend, that money simply leaves the index — Price does not collect it. It is the version most stock-chart websites display, and the reason comparing your ETF (which does collect dividends) against a Price chart systematically produces the illusion that the fund is “beating the index”.
There is one exception, with a precise threshold: special dividends worth at least 5% of the stock’s price (and “extraordinary” capital repayments) do affect Price too, via a price adjustment factor applied to all three versions. The handbook adds a true-rulebook detail: if a dividend is announced above the threshold and later falls below it, the adjustment stays anyway. And a special dividend below 5% is reinvested in the Total Return versions but excluded from the stock’s dividend-yield calculation — unless it is paid for at least three consecutive calendar years.
Gross and Net: the theoretical max and min
The two “Total Return” versions reinvest ordinary cash dividends into the index on the day the stock trades ex-dividend. The difference is how much they reinvest, and the handbook states it with rare candour: Gross “approximates the maximum possible reinvestment” — the amount a resident of the company’s country would collect, without tax credits — while Net “approximates the minimum”: the dividend after the highest withholding rate, the one hitting a foreign institutional investor with no double-taxation treaty at all (a rule in force since 1 December 2009). A real investor’s return sits, by construction, between the two. One clarification: “maximum” and “minimum” refer to MSCI’s reinvestment conventions, not to absolute bounds on what a real investor can obtain.
Behind the reinvestment sits a meticulous machine: every dividend must be confirmed by at least two distinct data sources before entering the calculation. And where companies announce the amount after the ex-date — as happens systematically in Japan — MSCI reinvests an estimate (failing that, last year’s dividend) and settles the difference later, without ever rewriting history; for Korea, with no basis for an estimate, zero is reinvested.
The withholding table, country by country
How heavy is the withholding Net assumes? It depends on the country — and the differences are enormous. The applied rate is the maximum for a foreign institutional investor without treaties, determined by the company’s country of incorporation (not its index classification), reviewed quarterly together with the Index Reviews:
At the two extremes: Switzerland withholds 35%, the United Kingdom zero — on British dividends Gross and Net coincide. In between, rates to the third decimal show how closely MSCI tracks tax systems: Germany at 26.375% (25% plus the solidarity surcharge), Japan at 15.315%. Imputation-system tax credits are ignored in both Gross and Net; some REITs carry dedicated rates, different from their country’s.
Compounded over the index’s ~70 percentage points of US weight, these withholdings carve a gap you can see with the naked eye:
Why an ETF can beat its index
Here theory meets our data. If Net assumes the worst-taxed investor in the world, anyone taxed better starts with a structural advantage — and UCITS funds are: the handbook itself acknowledges that “countries can eliminate this double taxation by signing bilateral treaties”. That is the case of Ireland-domiciled funds, whose prospectuses declare a treaty rate of 15% on US dividends — exactly half the 30% Net assumes (the treaty rate is not in MSCI’s documents: the sources are the US-Ireland bilateral treaty and the issuers’ prospectuses).
The result is measurable, and it is what we do every day with the tracking difference: over the last year, 5 of the 7 MSCI World ETFs we compute it for returned more than their Net index — by +0.03 to +0.18 percentage points, already net of all fund costs (our registry, data as of 7 September 2026; the table at the top of this page lists them fund by fund). It is not magic: securities lending and replication optimisation can contribute too, but one structural reason is an index assuming more tax than a well-domiciled fund actually pays. It is also why a positive tracking difference should not be suspicious in itself — while a very negative one remains the warning light that something (costs, replication, missing securities lending) is eroding the advantage.
The same index, in another currency
The second axis is currency, and here the handbook holds a surprise: the euro, sterling or yen versions are not recalculated stock by stock — they are conversions of the dollar series, made at the 4:00 pm London exchange rates (the WMR fixings). Same index, same mathematics, different glasses. In 2025 the Net version returned +21.09% in dollars and +6.77% in euros: the difference is all currency, not performance.
The currency effect goes as far as redrawing the history of the worst moments: the MSCI World’s maximum drawdown is −57.82% in dollars (October 2007 to March 2009), but −53.60% in euros — and over a different period, May 2001 to March 2009. Same index, different crashes, different dates. There is also a “Local Currency” version, which cancels currencies to measure local prices only: the handbook describes it as a theoretical continuously-hedged portfolio, not replicable in practice. And hedged indexes — the ones with real currency hedging — have a separate methodology, in a dedicated book this series has not examined: we stop where our reading stops.
The right yardstick for judging an ETF
Putting it back together: to judge an ETF you need the Net version of its index, in the currency of the share class you own. That is almost always the benchmark declared in UCITS fund documents, and it is the comparison we run when computing the tracking difference — fund and index in the same currency, dividends reinvested on both sides. Against Price, an ETF will always look like a champion; against Gross, always behind; in another currency, the exchange rate will play the part of performance.
One last factsheet curiosity, for anyone comparing historical series: the official versions were not all born together. In the MSCI World factsheets the Gross series’ “since” return starts on 31 December 1998, the Net series’ on 29 December 2000 — while the index has existed since 1986 (with history reconstructed back to 1969). Even birth dates, in indexes, deserve a second look.
And with this question the series closes: five instalments to open the black box — what the index is, who gets in, who governs it, how it is executed, and with what yardstick it is judged. The same five questions, from now on, we will take to the other index providers: the rules change, the right questions do not.
Frequently asked questions
Why are ETFs compared against the Net version?
Because the fund also suffers withholding on foreign dividends: comparing against Gross (full dividends) would be unrealistic by construction. The benchmark declared in UCITS fund documents is normally the Net Total Return version in the share class currency.
What do NR, GR and PR next to an index name mean?
Net Return, Gross Return and Price Return: the three official versions. NR reinvests dividends after the maximum withholding, GR reinvests them in full, PR counts prices only. The same index can therefore appear with three different numbers.
My ETF returned more than its index: how is that possible?
Usually because the Net index assumes the worst-case withholding (no treaty), while a well-domiciled fund pays less — for instance the 15% treaty rate on US dividends for Irish funds instead of the 30% the index assumes. The tax advantage can exceed the fund’s costs.
What happens to dividends in the Price version?
They leave the index uncollected: Price measures prices only. The exception is special dividends worth at least 5% of the stock’s price, which adjust the price in all three versions via an adjustment factor.
Why is the dollar return so different from the euro return?
Because currency versions are conversions of the dollar series at the 4:00 pm London fixings: the gap between +21.09% (USD) and +6.77% (EUR) for Net in 2025 is entirely the euro-dollar exchange rate, not stock selection.
What is the “Local Currency” version?
A series using the same exchange rate in numerator and denominator, cancelling the currency effect: it measures local price moves only. MSCI describes it as a theoretical continuously-hedged portfolio, not replicable in practice.
Which withholding rates does MSCI use in Net?
The maximum rates applicable to a foreign institutional investor without treaties, by the company’s country of incorporation: for instance 30% for the US, 35% for Switzerland, 26.375% for Germany, 15.315% for Japan and 0% for the UK (Appendix VI of the calculation methodology, June 2026 edition).
Since when do the MSCI World Net and Gross series exist?
In the official factsheets the Gross series’ “since” return starts on 31 December 1998 and the Net series’ on 29 December 2000, while the index has existed since 1986: the official versions were not born with the index — worth remembering in historical comparisons.