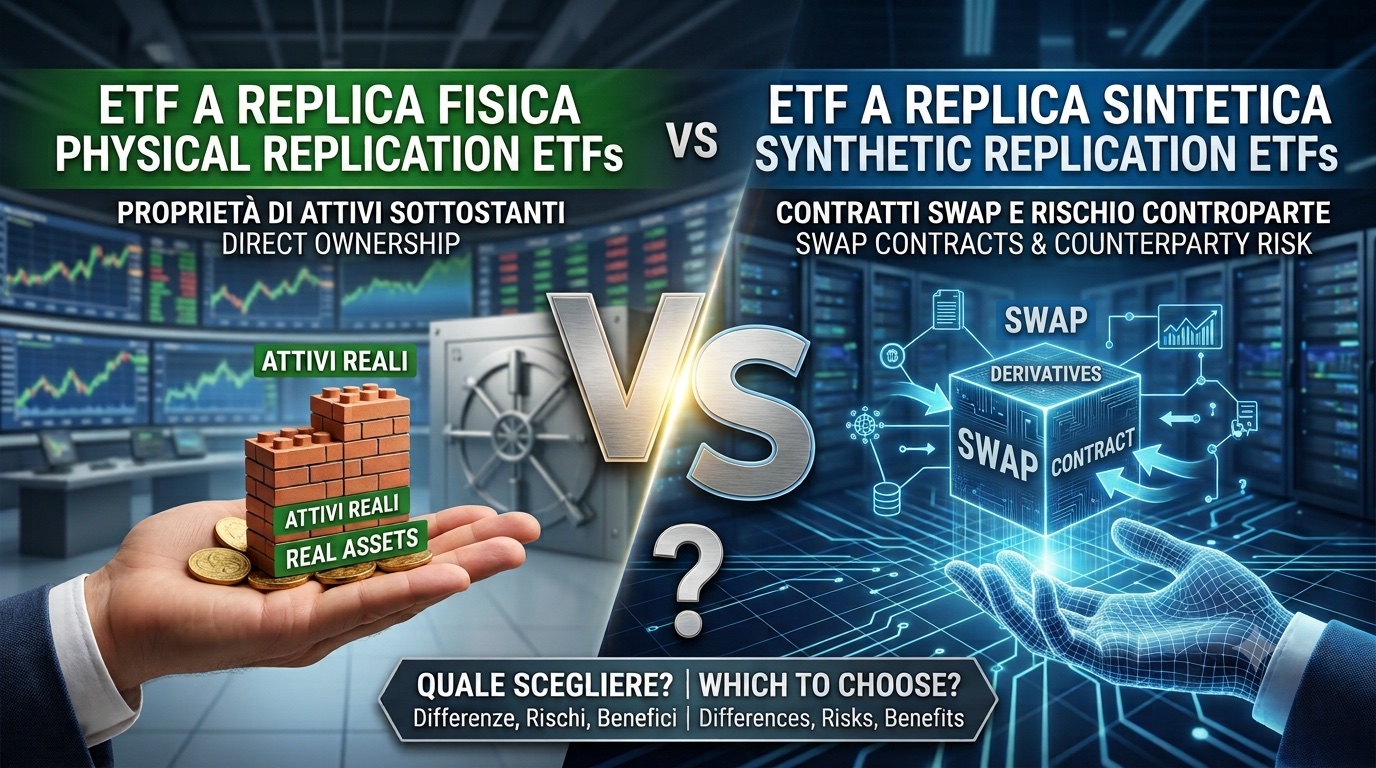
Two ETFs tracking the same index can hold completely different things. One buys the shares it will track; the other buys something else and has a bank promise it the index return. Understanding the difference is not about picking a “winner”: it is about knowing what you own, what you risk and — in some countries — how much tax you pay.
One email when a new article is out, with Rebalix product news at the end. Nothing else: no ads, no data shared with third parties, one click to unsubscribe.
The two roads
When you buy a share of an index ETF — the S&P 500, the FTSE MIB, a basket of government bonds — your money goes into a fund. From there, two roads are possible.
The first is the intuitive one: the fund buys the securities in the index. Through the fund, you own a slice of every company or bond the index contains. This is physical replication.
The second is less intuitive: the fund buys a basket of securities that may have nothing to do with the index, and in parallel signs a contract with a bank — a swap, i.e. an exchange — where the two promise each other: “I pass you the return of my basket, you pass me the return of the index”. This is synthetic replication.
The two roads have not always carried the same traffic. Before 2008 the synthetic route was the busier one in Europe; after the Lehman crash — with international regulators questioning counterparty risk and competitors fanning the flames — investors switched sides en masse: between 2010 and 2020 the synthetic share collapsed from 46% to 17% of equity assets, and from 35% to 5% of bond assets (per Morningstar). But synthetics are no dying niche: on US indices — the S&P 500 above all — they have been regaining ground, for a tax reason we cover in section 7.
Physical replication: three ways to fill the glass
A physically replicating ETF buys the index securities directly — all of them, or a representative subset — and keeps them with an independent depositary bank. “Buying the index” sounds like one operation, though; it is actually done in three ways.
With full replication the fund buys every security in the index, each at its weight. It is the default when the index holds large, liquid names: for an S&P 500 it is the norm.
When the index holds thousands of securities, or hard-to-buy ones, full replication becomes costly or impractical: a global bond index can contain over 25,000 bonds, many of which go months without trading. Enter sampling — buying a representative subset chosen to resemble the index by issuer, maturity and yield — and optimisation, where a mathematical model picks the subset with the explicit goal of minimising the expected gap to the index.
The practical consequence: a sampling physical fund can drift from the index more than you would expect — not because it is “broken”, but because it only owns part of the securities. The prospectus states which technique is used (a fund declaring sampling may fully replicate in practice, but not the other way round).
Securities lending: the counterparty risk physical ETFs rarely mention
One detail makes the comparison with synthetics more honest than it is usually told: many physical ETFs carry counterparty risk too. It is called securities lending: the fund temporarily lends part of the shares it owns to third parties (typically short sellers), in exchange for a fee and collateral worth as much or more.
Lending generates a small revenue that lowers the fund’s effective cost. The right question is: how much of that revenue goes back to the fund, and how much stays with the issuer? You do not need to ask anyone: under European rules this must be published. The revenue-sharing policy is in the prospectus — including who collects the fees and whether it is an affiliate of the issuer — and the actual yearly revenues and costs are in the annual report.
On paper, the rule set by ESMA — the EU markets watchdog, more in section 5 — says “all net revenues” must return to the fund. The catch is what gets deducted first: the lending agent’s fee, often an affiliate of the same group. Some real numbers from official documents: iShares funds keep 62.5% of gross revenue (37.5% goes to BlackRock, which covers operating costs); for Xtrackers it depends on the platform — 82% to equity funds (91% for the two DAX ETFs), 70% to Xtrackers II bond funds (per their Securities Lending Policy, effective February 2024); Vanguard lends as well, but the manager keeps nothing: the prospectus (April 2026, copy on Borsa Italiana) states net revenue is paid back into the fund and that no lending is done with Vanguard group entities — the agent is a third party, covering its costs out of its own fee. Same activity, different slices and models — all in writing, if you know where to look.
The risk is remote — collateral is marked daily and some issuers offer borrower-default indemnification — but it exists. Keep it in mind for section 5: the honest comparison between physical and synthetic is not “risk versus zero risk”, but two differently-shaped, both regulated, risks.
Synthetic replication: swapping returns
A synthetic ETF does not buy the index securities: it owns (or holds as collateral) other securities, plus a contract with a bank that guarantees it the index return. The contract — a total return swap — says: the fund passes the bank the return of its basket, the bank passes the fund the return of the index, minus a cost called the swap spread. There are two architectures.
The unfunded model: the fund owns the basket
It is the most common model in Europe. The fund uses investors’ cash to buy a basket of securities — the substitute basket — which remains its property, held in a segregated account. If the swap bank failed, those securities stay with the fund.
The risk here lies in the gap: if the index rises more than the basket, the bank “owes” the fund the difference. That gap — the counterparty exposure — is what the fund would (partly) lose if the bank failed at that very moment. European law caps it, and in practice issuers reset it to zero frequently, often daily:
The funded model: the fund holds collateral
In the funded variant the fund buys no basket: it passes the cash to the bank, which pledges the index return and posts a package of securities — the collateral — with a third-party custodian, in a separate account, typically worth more than the fund’s assets.
The collateral can be held in the fund’s own name (title transfer: on default the securities pass to the fund at once) or stay in the bank’s name pledged to the fund (pledge: the fund must enforce it first). A technical difference that means nothing on quiet days, and quite a lot on the wrong day — which is why it is among the questions in section 9.
What you really own: the basket up close
“The substitute basket is correlated with the index” is the phrase you read everywhere. How much, really? We measured it on one of Europe’s largest synthetic S&P 500 ETFs — the Xtrackers S&P 500 Swap, about €7 billion in assets — using the full lists the issuer itself publishes. First, though, the thermometer we will use:
A fund tracking America’s 500 largest companies held, at our latest reading, almost a third of its assets outside the United States (28.4%): Japanese banks, German and Portuguese utilities, a Tokyo memory-chip maker — while 337 index names were missing altogether, including JPMorgan, Exxon Mobil, Visa, Costco, Netflix, and Apple weighed little more than a third of its real weight. The 56.5% active share says it in one number: turning this basket into the index would mean selling and rebuying more than half the portfolio.
This is no scandal: it is how the model normally works, and the return you receive remains the index’s. But it is what you would own if the swap failed — which is why issuers publish the basket daily on their sites: looking at it at least once is an exercise we recommend to anyone holding a synthetic ETF.
Nor is it an isolated or new phenomenon. The only comparable analysis we found — the December 2020 Vanguard research paper — documented the same mechanism on a synthetic MSCI World ETF, the most popular index among European savers: a 354-security basket versus 1,607, France at 18% versus 3.3%, the UK absent. So we redid that one too, on the same index, with today’s data (Xtrackers MSCI World Swap):
Seven years later, on a different fund, the basket’s concentration is almost unchanged (39.7% then, 40.7% now): the mechanism is no accident — it is simply how swap desks build baskets. Since then, as far as we could find, nobody else has published comparisons like these — we will keep ours up to date.
The rules that protect you (the ones articles never explain)
Nearly every article on the topic cites “the UCITS directive requirements” without saying what they are. Here they are, in plain words, from the original sources: the European directive 2009/65/EC (the “UCITS directive”, consolidated text — the 2026 update touched liquidity tools and delegation, not these rules) and the guidelines on ETFs and other UCITS that implement it. Who writes them? ESMA (the European Securities and Markets Authority): the EU authority that supervises financial markets and coordinates national regulators. Its guidelines bind fund managers, and they are public — 15 readable pages.
The exposure cap. The gap between the fund’s value and what the fund owns (or holds as collateral) cannot exceed 10% of assets when the counterparty is a supervised bank, 5% otherwise: even on the worst day, at least 90% is covered by real securities. In practice most issuers do better — resetting daily or holding collateral above 100%.
The collateral rules (ESMA guidelines, in force since 2013). Collateral must be: liquid and listed; valued daily, with prudential haircuts on volatile assets; high quality and independent of the counterparty (the bank cannot back you with its own bonds); diversified (max 20% of assets per single issuer, aggregating all collateral); enforceable at any time without the bank’s consent; not re-usable (the fund cannot lend or pledge it in turn).
The index rule. An index replicable by a UCITS cannot have a single component above 20% (35% in exceptional cases). This is why no “gold-only” UCITS ETF exists: single-commodity products are ETCs, a different wrapper, outside these protections.
Before all that: who keeps the assets
One protection comes before all the others, applies equally to physical and synthetic funds, and is written in every KID. The fund’s assets do not sit with the issuer: they sit with an independent depositary bank, legally required to keep them separate from its own. If the issuer fails, the fund’s securities are not part of its bankruptcy. If the depositary itself failed, segregation still protects the assets, and the depositary is legally liable for losses caused by negligence or fraud.
One thing the KID says just as clearly: an ETF is not a bank deposit. If the fund loses value, nobody reimburses the loss. National compensation schemes exist, but they cover a different risk: they kick in if your broker fails and your securities are not returned. In Europe they stem from directive 97/9/EC (minimum cover €20,000): in Italy the Fondo Nazionale di Garanzia (up to €20,000 per investor, in Italian), in the UK the FSCS (up to £85,000), in Germany the EdW (90%, max €20,000), in France the FGDR (up to €70,000).
Do not misread those amounts: they do not mean you recover at most €20,000 if your broker fails. In the normal case you recover everything, with no cap: your securities are segregated from the broker’s own assets by law, and on failure they are returned or transferred to another intermediary in full. The compensation scheme is the last net, for the pathological case: if segregation was breached — fraud, shortfalls — and securities are missing at the roll call, it covers the missing part up to those amounts. (Cash on the account is a separate matter: at a bank it is protected by the deposit guarantee scheme, up to €100,000.) Recapping the possible “worst days”: the issuer fails → assets are safe at the depositary; a securities-lending borrower fails → there is collateral; the swap counterparty fails → there is the basket or the collateral, with a maximum 10% uncovered. Three different risks, three different protections — none of which is “zero risk”.
Two independent studies verified how these rules work in practice. Morningstar (2012), after the season of regulatory warnings, found most issuers applied thresholds tighter than the legal minimum. An academic study in the Journal of Banking & Finance (2019) — free full text here — measured actual exposures and concluded the fears about collateral quality were unfounded (funds were over-collateralised on average) and the residual risk was compensated by lower overall holding costs. Neither study says “zero risk”: they say “small, regulated, visible risk — if you know where to look”.
Tracking and transparency: the real trade-off
First the two terms, because half of the comparisons online use them backwards:
- Tracking difference: how much the fund returned below (or above) the index over a period. This is the number that costs (or makes) you money.
- Tracking error: how much that difference fluctuates over time. It measures predictability, not cost.
Now the trade-off. Synthetics, by construction, track the index very faithfully: the contract guarantees the return, not a sampling manager’s skill. In less liquid markets the difference shows: among UCITS ETFs tracking MSCI Emerging Markets, average 3-year tracking error was 0.69% for synthetics versus 1.21% for physical funds (Vanguard data as of 30/9/2020). Yet in the same sample the average tracking difference was worse for synthetics: −0.65% a year versus −0.39%. More faithful, and more expensive — with the cost hidden in the swap spread.
And here is the transparency point, worth a general rule: a physical fund’s tracking difference can be decomposed (known ongoing charges + known withholding + lending revenue); a synthetic’s cannot, because the swap spread is not published and changes over time. Morningstar wrote it in 2012 and repeated it in 2021: nine years on, swap-cost opacity remains the model’s weak spot. When a synthetic outperforms expectations you never quite know why — nor when it underperforms.
How much is it worth, measured on real returns? We computed it on the cleanest pair in existence — same issuer, same index: iShares’ S&P 500 in synthetic (I500) and physical (CSPX) form, using the performance series the issuer itself publishes:
The measured gap — 17–24 basis points a year in the synthetic fund’s favour — matches almost exactly the theoretical withholding advantage covered in section 7 (higher in years when dividends yielded more). Theory, verified on the numbers: on the S&P 500 the synthetic tax edge really does reach the fund, and the swap spread eats little or none of it.
To check your own ETF: trackingdifferences.com is the community reference for tracking differences measured on official data, across hundreds of funds.
The US dividend withholding savings
Here synthetics hold a structural advantage — the reason for their comeback on US indices. The mechanism happens entirely before you enter the picture. When a US company pays a dividend to a European fund, the US taxman withholds a slice at the border: 15% for Irish-domiciled funds (thanks to the US–Ireland treaty), 30% for Luxembourg ones. A physical ETF suffers this on every dividend. A synthetic ETF does not: it owns no shares, and the index return reaches it inside the swap. Under US tax rule “871(m)”, derivatives on qualified indices — the S&P 500 and Nasdaq-100 qualify — can receive the return with dividends in full, no withholding.
How much is it worth? It depends on dividends: at the S&P 500’s current dividend yield (1.17%), the 15% saved is worth about 18 basis points a year. Articles written when yields were higher say “0.30%”: true at the time. Three honest caveats: the benefit reaches the fund only to the extent the swap bank passes it on; rule 871(m) is a regime the IRS reviews and extends periodically (latest extension: through the end of 2026); and none of this changes the taxes you pay — those depend on where you live.
One warning to prevent a classic mix-up: these savings have nothing to do with accumulating vs distributing share classes — physical accumulating and synthetic distributing funds both exist; the choices are orthogonal. The same logic applies elsewhere in miniature: withholding taxes exist on European dividends too, but there swaps track net return indices and the advantage largely vanishes — the big, clean case is the American one. (In the UK, swaps on UK equities also avoid the 0.5% stamp duty on purchases — a transaction tax, though, not a dividend one.)
The national layer: same structure, five different taxmen
The Italian case: when the basket sets your taxes
A necessary premise: everything in this section applies only to Italian tax residents — if you live elsewhere, your country’s rules apply (section 7). Italy taxes ETF gains at 26%, but the share attributable to government bonds (Italian or from cooperative countries) is taxed at 12.5%. How is that share computed? On the average share of fund assets invested in government securities, from the fund’s last two reports. The assets. Not the index.
For a physical ETF the two coincide. For a synthetic they do not — and the difference is not theoretical. Take XEON — the Xtrackers II EUR Overnight Rate Swap UCITS ETF (ISIN LU0290358497), one of Europe’s largest money-market ETFs, covered in our guide to the XEON money-market ETF: a swap fund tracking the €STR rate, whose index is an interest rate — zero government bonds by definition. But its substitute basket is mostly made of government bonds. The result, in black and white in the issuer’s semi-annual tax certifications:
Three lessons in one table. First: an Italian investor in this fund pays 12.5% (not 26%) on most gains — today on the 78.1% share — an effect you would never guess from the index. Second: the reverse holds too — a synthetic fund on a government bond index whose basket held no government bonds would lose the reduced rate. Third: the share swings (from 97% to 78% in three years), because the basket changes. To check your own fund, see the issuer’s semi-annual tax documents — or, much faster, our ETF taxation and white-list database (in Italian, for Italian tax residents): search by name or ISIN for rates and worked examples (the XEON page is here).
When each one makes sense
There is no winner. There is a map:
Questions to ask before buying (and where the answers live)
For a physical fund: which replication technique does it use (KID/prospectus)? Does it lend securities, within what limits, and how much of the revenue returns to the fund (issuer documents)? Is there borrower-default indemnification? On limits, two real examples: DWS’s policy caps lending at 50% of assets for Xtrackers equity funds (up to 100% for Xtrackers II bond funds, 23% for PEA-eligible ETFs); Vanguard’s prospectus caps lending at 50% of assets and 20% per single counterparty.
For a synthetic fund: unfunded or funded? One counterparty or several? (Most issuers now use more than one, Morningstar finds — the single parent-bank model is a relic on its way out.) How often is exposure reset? What is in the basket or collateral, today (issuer’s site, updated daily)? Under a pledge, how fast is enforcement? And the question almost nobody asks: how has tracking difference compared with physical rivals over the past 3–5 years?
The third road: hybrid replication
If you have read this far, the question asks itself: why choose? The swap earns more where the US dividend withholding bites; physical replication is simpler and can lend securities where that advantage does not exist. Can the two not be combined?
Since late 2024 one fund does exactly that, by declaration: the Scalable MSCI AC World Xtrackers UCITS ETF (ISIN LU2903252349, ticker SCWX, also listed on Borsa Italiana) tracks the MSCI ACWI — developed and emerging markets together — under what the prospectus calls a Hybrid Investment Policy: it actually buys the European and Japanese shares, while US exposure comes via swap. At our latest reading (27 July 2026) the physical basket held 755 securities, almost all outside the US: American shares — more than half the index — weighed just 0.4% of assets. It is the substitute-basket mechanics of section 4, used only where it pays.
One detail the label does not tell you: the prospectus fixes no split between physical and synthetic, and the manager may vary it on any trading day — up to the extremes, all physical or all swap. Buying a “hybrid” means delegating the dosage too.
Does it work? It can be measured — the same exercise as section 6, repeated here between the hybrid and a large physical fund on the same index, on the NAVs the two issuers publish:
Why do fees matter when we are comparing NAVs? Because an ETF never bills its costs separately: it deducts them inside the fund, a microscopic slice every day, and the published share value is already net of them. Two identical funds with different costs therefore drift apart by exactly that difference: today the physical fund runs with a 0.20%-a-year backpack that the hybrid, on promotion, does not carry. When the promotion ends the backpacks will be nearly level again — and the table above, recomputed every week, will show it on its own.
The idea itself is not new: it is how some issuers already assemble multi-asset portfolios. In the four Xtrackers Diversified Portfolios, for instance, the synthetic share grows with the equity weight — from 0% in the most cautious profile to about 44% in the most aggressive — because the swap only pays on equities: the bonds stay physically replicated, and the gold comes not through a futures index but through an ETC holding physical metal — precisely the wrapper from the map above. The numbers, updated daily, are in our dedicated article.
Worth watching? Yes. Worth calling the final answer? Too soon: declared hybrid funds can currently be counted on one hand — this is the first — and they carry the complexity of both worlds, the swap’s counterparty risk and the physical sleeve’s securities lending. The third road exists; its history has just begun.
The destination, in three lines. The replication method tells you what you really own and — in some countries — how you are taxed, but on its own it does not make an ETF good or bad: measured tracking difference, effective costs, fund size and liquidity matter just as much. That is why this guide measures instead of taking sides — real baskets, certified percentages, rules read at the source. Choosing well is not picking a faction: it is knowing what you are buying.
FAQ
How do I find out whether my ETF is physical or synthetic?
From the KID or the fund page: look for “physical/full/sampling replication” or “synthetic/swap replication”. Often the name says it: if it contains the word “Swap”, it is synthetic.
If my ETF’s issuer fails, do I lose my money?
No: the fund’s assets are held by an independent depositary bank, legally segregated both from the issuer’s assets and from the depositary’s own. But remember an ETF is not a bank deposit: no scheme guarantees the value of your shares — national compensation schemes cover fraud shortfalls at your broker; in an ordinary broker failure your securities, segregated by law, come back to you in full and uncapped.
If the swap bank fails, do I lose everything?
No. The fund owns the substitute basket (or enforces the collateral), and by law the uncovered exposure cannot exceed 10% of assets — in practice issuers keep it near zero. The realistic risk is not “losing everything”, but losing a small fraction and holding, for a while, a portfolio different from the index.
Why does my S&P 500 ETF beat the index?
Almost always it is the dividend withholding effect: the “net return” benchmark assumes a 30% withholding, while an Irish fund pays 15% and a synthetic 0%. Beating that index is not magic: it is tax arithmetic.
Where can I see my synthetic ETF’s substitute basket?
On the issuer’s site, on the fund page: the composition is published and updated every trading day. If you cannot find it, that is an answer too.
Are synthetics taxed differently in Italy?
The headline rate is the same (26%), but the 12.5% reduced-rate share is computed on what the fund actually owns — the basket, not the index. The result can surprise in both directions: see section 8.
Does securities lending make a physical ETF risky?
It adds a small risk, collateralised daily. What to check: lending limits, and how much of the revenue returns to the fund.
Where do I check my ETF’s tracking difference?
On trackingdifferences.com, measured on official NAV data.
What is a hybrid-replication ETF?
A fund that, within the same portfolio, replicates some markets physically and others via swap — typically physical where no tax edge exists, synthetic on US indices. The first declared one arrived in late 2024: section 10 explains how it works.
So which is better, physical or synthetic?
It depends on the market and on what matters most to you among simplicity, tracking fidelity and taxation. The map in section 9 is the starting point; the choice remains yours.
Sources
- Vanguard Research, “An overview of physical and synthetic ETF structures” (Corsi, Hussain, Hsu), December 2020.
- Morningstar ETF Research, “Synthetic ETFs Under the Microscope: A Global Study”, May 2012 (archived copy) — and the follow-up “Spotlight on Synthetic ETFs in Europe”, March 2021 (public summary).
- Hurlin, Iseli, Pérignon, Yeung, “The Counterparty Risk Exposure of ETF Investors”, Journal of Banking & Finance, 2019 — open-access preprint.
- Directive 2009/65/EC (UCITS), consolidated text on EUR-Lex — including the amendments of directive (EU) 2024/927 — and ESMA guidelines 2012/832 on ETFs and other UCITS issues.
- IRS, Section 871(m) and Notice 2024-44 (transition regime extended through the end of 2026).
- Italian Ministerial Decree of 13 December 2011 and Revenue Agency circular 11/E of 28/3/2012 (government-securities share in funds, in Italian); DWS semi-annual tax documents for the XEON case.
- §20 InvStG (Germany, Teilfreistellung, in German); PEA rules (France); directive 97/9/EC on investor compensation schemes.
- Full basket and index lists for Xtrackers S&P 500 Swap 1C and MSCI World Swap 1C, from DWS official exports (26/7/2026); Xtrackers Securities Lending Policy; Vanguard Funds plc prospectus, 28/4/2026.
- Xtrackers prospectus (Product Annex “Scalable MSCI AC World Xtrackers UCITS ETF”, Hybrid Investment Policy) and KID — current versions are always filed on the fund’s Borsa Italiana page; physical basket, NAV and index from the data service behind the DWS fund page (27 July 2026); the physical iShares MSCI ACWI NAV series from the issuer’s product page.
- trackingdifferences.com — tracking differences measured on official data.